Weibold Academy: State and trends of carbon pricing (World Bank Report 2022)
Weibold Academy article series discusses periodically the practical developments and scientific research findings in the end-of-life tire (ELT) recycling and pyrolysis industry.
This article is a review by Claus Lamer – the senior pyrolysis consultant at Weibold. One of the goals of this review is to give entrepreneurs in this industry, project initiators, investors and the public, a better insight into a rapidly growing circular economy. At the same time, this article series should also be a stimulus for discussion.
Introduction
Pyrolysis of waste rubber and End-of-Life tires is a chemical recycling operation by which waste materials are reprocessed into chemical products (rCB and TDO) to become input feedstock for chemical plants and other industries. Therefore, chemical recyclers are both waste managers and manufacturers of new substances in the sense of the circular economy.
Chemical recycling operations can help avoiding or reducing greenhouse gas emissions and reduces the use of primary raw materials while increasing the use of sustainable secondary raw materials (SRM). They are supporting the overarching and concrete specified goals of the EU Green Deal and the UN Sustainable Development Goals, while contributing to the GHG reductions in the manufacture of tires, technical rubber good and plastic masterbatches (etc.).
The current series of articles would like to take up a topic that is currently much discussed among players in the chemical recycling industry and contribute to a better understanding of the instruments, functions and possibilities of GHG emissions pricing (and their trading instruments).

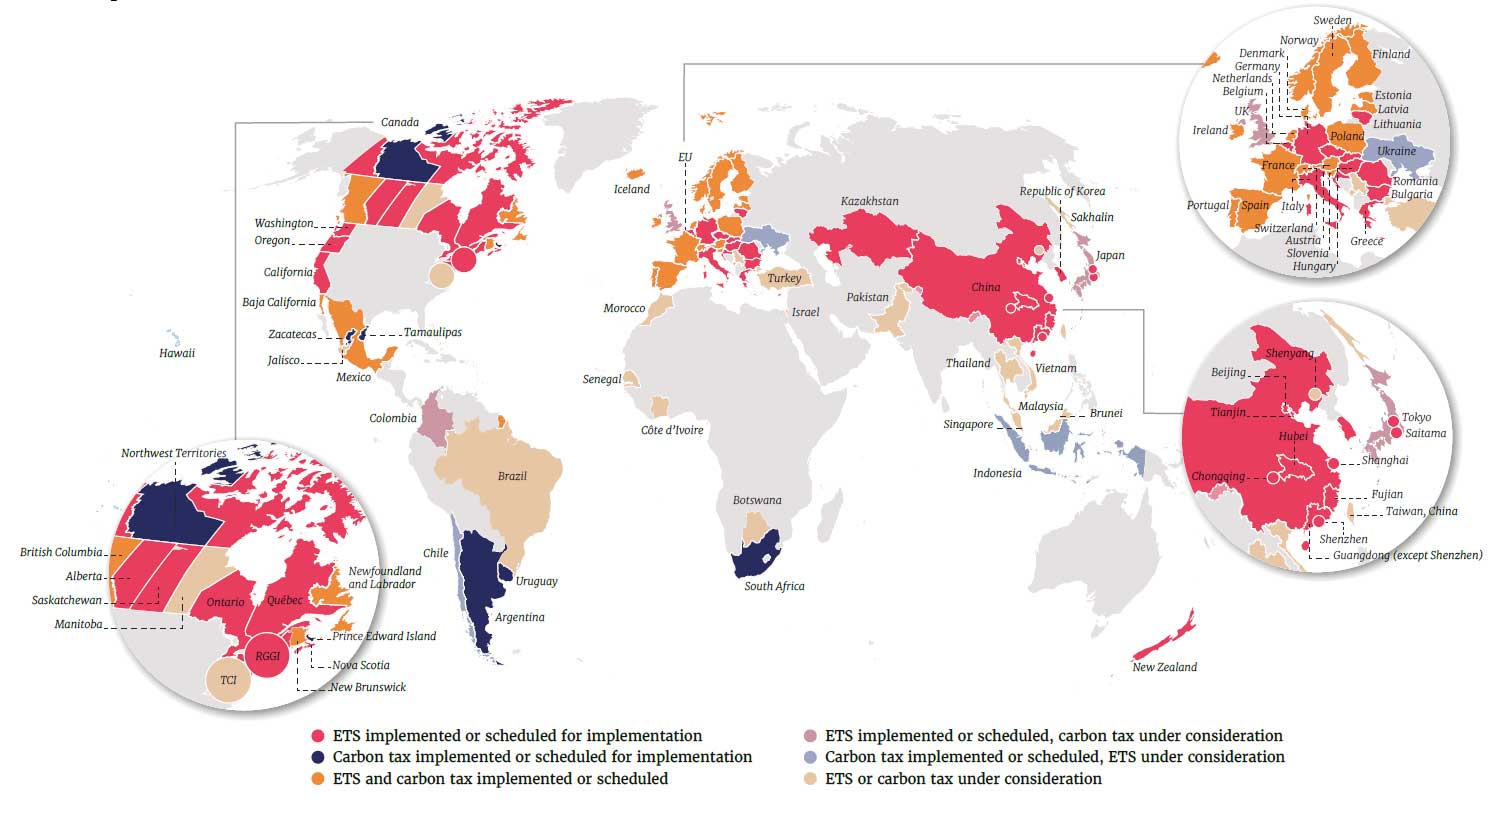
Source: The World Bank 2022: Map of carbon taxes and emissions trading systems (ETSs); State and Trends of Carbon Pricing 2022 (worldbank.org).
What is carbon pricing
Carbon pricing is a policy tool that governments can use as part of their broader climate strategy. A price is placed on greenhouse gas emissions, which creates a financial incentive to reduce those emissions or enhance removals. By incorporating climate change costs into economic decision-making, carbon pricing can help encourage changes in production, consumption, and investment patterns, thereby underpinning low-carbon growth.
Carbon pricing instruments (CPIs) generally aim to remove price barriers to low-carbon development. But these are often not the only types of obstacles that should be addressed for effective climate policy. As such, CPIs typically need to be complemented and enhanced by other types of policies that address a broader range of climate change challenges and market failures. This can include research and development, sector-specific regulations, investment in technology and infrastructure, the removal of regulatory barriers, and market reforms to enable incentive-based approaches. Additional measures may also be needed to mitigate undesirable impacts of climate policies on specific sectors or groups in society.
The climate impact of carbon pricing depends on how broadly the price is applied, the price level, and the availability of abatement opportunities. Economy-wide carbon pricing policies are more effective than carbon prices restricted to certain sectors or goods and higher carbon prices incentivize greater emission reductions. Creating a credible and more predictable price signal over the longer term will support long-term investments and incentivize low-carbon development.
Carbon pricing instruments
Carbon pricing instruments can broadly be grouped into two categories: direct and indirect carbon pricing.
Direct carbon pricing refers to CPIs that apply a price incentive directly proportional to the greenhouse gas emissions generated by a given product or activity, primarily through a carbon tax or an Emissions trading system (ETS). By applying the same price per metric ton of carbon dioxide (CO2) across multiple sources, direct carbon pricing ensures that abatement incentives are consistent and cost-effective. Carbon crediting mechanisms are another form of carbon pricing, and are included in the scope of this report, but operate differently from ETSs and carbon taxes. Participation in crediting mechanisms is generally voluntary, and unlike carbon taxes and ETSs, these mechanisms do not in themselves create a broad-based carbon price. Instead, they offer a subsidy to emissions abatement among selected eligible activities. Crediting mechanisms function in concert with initiatives that create demand for emission-reducing activities at either the domestic or the international level.
Carbon tax: A policy instrument through which a government levies a fee on GHG emissions, providing a financial incentive to lower emissions. Under a carbon tax, the price of carbon is set by the government, and the market determines the level of emission reductions incentivized by the price.
Emissions trading system: ETS involves placing a limit or cap on the total volume of GHG emissions in one or more sectors of the economy. A government then auctions or distributes tradable emission allowances to entities covered by the cap, where each allowance represents the right to emit a certain volume of emissions, and the total volume of allowances equals the emissions cap. Covered entities are required to surrender allowances for their emissions during a compliance period. They can choose to buy additional allowances if necessary or sell surplus allowances. This policy type is also known as a “cap-and-trade” system.
Alternatively, an ETS may use a “baseline-and-credit” system, where there is no fixed limit on total emissions per sector, but covered entities can “earn” emission credits if they produce fewer emissions than the baseline. These credits can then be traded with covered entities that need additional credits to cover their surplus emissions relative to the baseline. Examples of these systems include intensity standards and tradable performance standards.
The price of carbon is not fixed by a government in an ETS but determined by the supply and demand of emission allowances or credits.
Carbon crediting mechanism refers to a system where tradable credits (typically representing a metric ton of carbon dioxide equivalent) are generated through voluntarily implemented emission reduction or removal activities. Carbon crediting mechanisms operate differently to carbon taxes and ETSs—rather than requiring businesses to pay for emitting (i.e., the polluter pays principle), businesses and other organizations can generate carbon credits (and hence revenue) by demonstrating that emissions have been reduced or sequestered relative to a counterfactual baseline.
Indirect carbon pricing refers to instruments that change the price of products associated with carbon emissions in ways that are not directly proportional to those emissions. These instruments provide a carbon price signal, even though they are often (primarily) adopted for other socioeconomic objectives, such as raising revenues or addressing air pollution. Examples of indirect carbon pricing include fuel and commodity taxes, as well as fuel subsidies affecting energy consumers. For example, fuel excise taxes that apply a flat tax amount to gasoline by the liter indirectly place a price on the carbon emissions from the combustion of that gasoline. Inversely, fuel subsidies that reduce the price of fossil fuels create a “negative” indirect carbon price signal, which incentivizes higher consumption and therefore increases carbon emissions. All policy instruments that focus on the price incentive for using fuels and commodities can be considered indirect carbon prices. However, regulations and investment incentives—which may address non-price related market failures but do not translate into a price equivalent—are not considered indirect carbon pricing.
Direct and indirect carbon prices interact globally and in specific jurisdictions. This means, for example, the price signal provided by a direct carbon price would be diluted if it were offset by an effective decrease to indirect carbon pricing, such as through the introduction of a subsidy that reduced fuel prices.

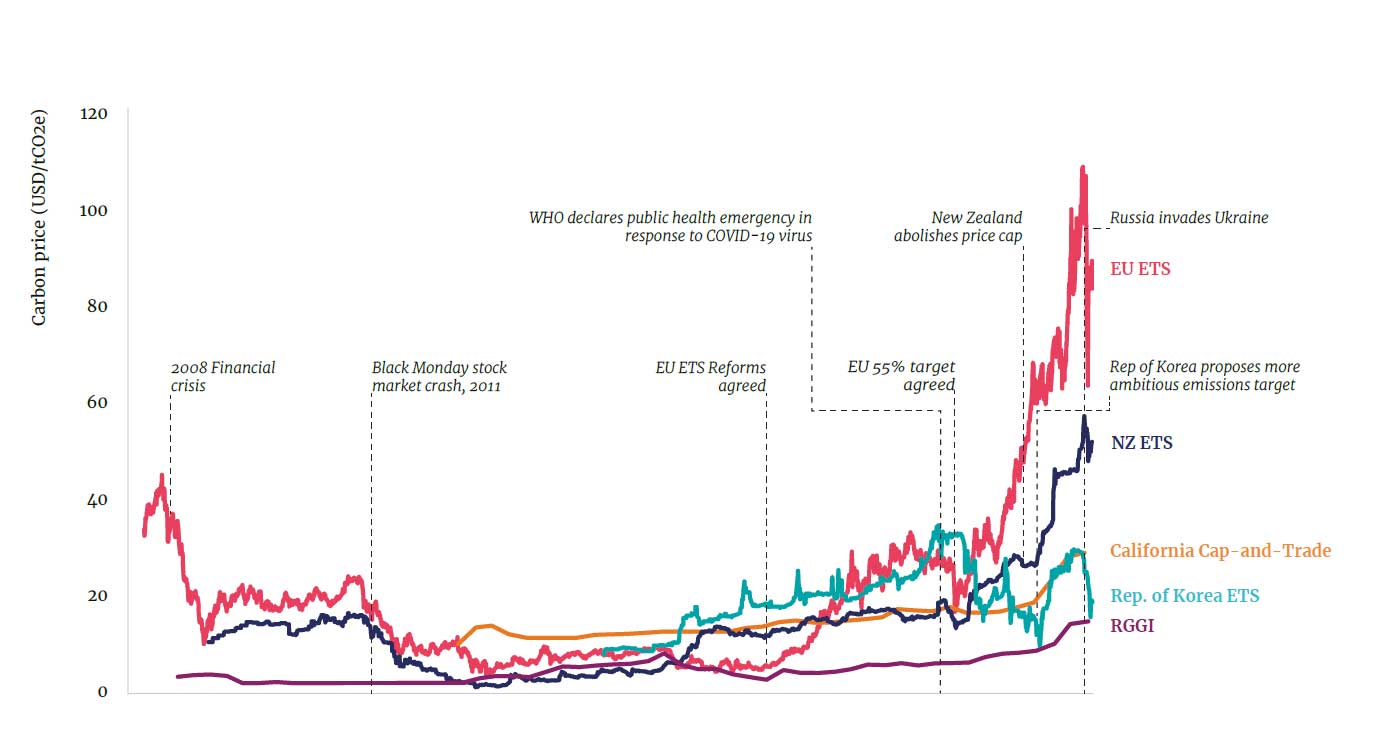
Source: The World Bank 2022: Price evolution in selected ETSs from 2008 to 2021; State and Trends of Carbon Pricing 2022 (worldbank.org)
Sharply increased carbon revenues
Carbon prices have hit record highs in many jurisdictions. Nonetheless, prices must rise considerably more to meet the Paris Agreement temperature goals, as less than 4% of global emissions are currently covered by a direct carbon price within the range needed by 2030.
ETS price spikes are driven by a combination of policy reforms, anticipated changes, speculative investment interest, and broader economic trends, especially in global energy commodity markets. Record ETS prices were observed in the European Union, California, New Zealand, and Republic of Korea, among other markets, while several carbon taxes also saw prices hit their highest levels yet.
Global carbon pricing revenue increased by almost 60% in the past year, to around USD 84 billion surpassing carbon tax revenues for the first time. While carbon taxes have historically generated more revenues than ETSs, the gap has narrowed in recent years and in 2021 ETSs generated over two thirds of total revenue (USD 56 billion). This largely reflects the fact that ETS prices are rising faster than fixed-price instruments. A second factor is the increasing share of auctioned allowances rather than free allocation.
Still low number of operational CPIs
The adoption of direct pricing continues but the global coverage remains low.
As of April 2022, there are (only) 68 CPIs operating with three more scheduled for implementation. This includes 37 carbon taxes and 34 ETSs. A new carbon tax in Uruguay commenced in January 2022 and three new ETSs also commenced in the past year in subnational jurisdictions in North America—Oregon, New Brunswick, and Ontario. One US state, Washington, as well as Indonesia and Austria, have CPIs scheduled for implementation.
Approximately 23% of total global GHG emissions are currently covered by operating CPIs (an increase of only 1.5% on the previous period).
While there have only been four new CPIs implemented since 2020, more jurisdictions took steps toward implementing or expanding carbon pricing. In addition to the instruments scheduled for introduction (i.e., in Austria, Indonesia, and Washington State), Israel, Malaysia, and Botswana announced their intentions to develop new CPIs and Vietnam outlined steps to set up an ETS. Several other jurisdictions in Africa, Central Europe, and Asia continue to assess the potential to implement CPIs.
EU ETS the largest carbon market by traded value
The largest carbon market by traded value, the EU ETS, saw record trading activity and prices in both spot and futures markets. Over 15 billion emission allowances were traded on the Intercontinental Exchange, the largest secondary market platform for EU allowances, with spot prices increasing almost threefold over the calendar year. The EU Climate Law entered into force in July 2021, which set the binding new EU-wide climate target to reduce GHG emissions by 55% in 2030 compared to 1990 levels and achieve net zero emissions by 2050. The package of measures that has been proposed to meet the new commitment (known as “Fit for 55”) includes the addition of a new, separate ETS covering transport and buildings. This would exist in parallel to the existing EU ETS, which covers the power, industry, and aviation sectors, though it would share some common elements, such as the market stability reserve (MSR). The proposed package of measures would also extend the scope of the existing EU ETS to include shipping emissions beginning in 2023 and covering 100% of emissions for voyages between member state ports and 50% for voyages between EU ports and third-country ports by 2026. The EU legislature is currently debating these proposals; the presidency for the Environment Council meeting in March 2022 indicated that the proposal to include shipping has broad support but the proposal to include transport and buildings has generated significant debate among member states and in the EU Parliament.
China`s new national ETS completed the first full compliance cycle
China hosts the world’s largest carbon market by emissions. The first full compliance cycle of the national ETS was completed in 2021, with a reported compliance rate of 99.5%. Over 2,100 liable power stations participated during this cycle, covering about 4.5 billion metric tons of CO2 equivalent per year. This accounts for over 30% of China’s total GHG emissions.
While the prices for emissions allowances remain relatively low compared to other pricing systems, the closing price for the year of USD 8.5 per metric ton of CO2 (tCO2) translated to an increase of around 13% over the six months since trading commenced. A total of 179 million tCO2e of allowances were traded in 2021, representing a cumulative turnover of close to USD 1.2 billion. While this represents relatively low volumes for a market the size of the Chinese ETS, it is not insignificant given the Chinese ETS is still taking key phase-in steps and compliance trading only commenced in earnest in October 2021 and currently only covered entities (i.e., not financial institutions) are allowed to make trades.
Summary
Carbon pricing can provide the impetus for economic transformation and recovery.
More ambitious carbon prices can help close the gap between pledges and policy and “keep 1.5 alive.” Along with lowering emissions, carbon pricing can improve energy and industrial efficiency, limit reliance on imported energy, promote cleaner air, protect and regenerate landscapes, and provide a valuable source of revenue.
Worldwide, 68 carbon pricing instruments (CPIs), including taxes and emissions trading systems (ETSs), are operating and three more are scheduled for implementation.
CPIs in operation cover approximately 23% of total global greenhouse gas (GHG) emissions. This represents only a small increase in total global coverage as a result of four new systems commencing in 2021.
Global carbon pricing revenue increased by almost 60% in the past year, to around USD 84 billion. With prices rising and reduced free allocation, ETS revenues surpassed carbon tax revenues for the first time.
Increasing carbon pricing revenues can support sustainable economic recovery, finance broader fiscal reforms, or help buffer countries from economic and international turbulence.
Source
The World Bank 2022: “State and Trends of Carbon Pricing 2022” (May 24th), World Bank, Washington, DC. Doi: 10.1596/978-1-4648-1895-0. License: Creative Commons Attribution CC BY 3.0 IGO.
Weibold is an international consulting company specializing exclusively in end-of-life tire recycling and pyrolysis. Since 1999, we have helped companies grow and build profitable businesses.


